
Jio, Airtel and Airtel Africa report rapid growth in data consumption, but their results show why additional gigabytes do not translate into proportional revenue — and why profitability matters as much as traffic.
Mobile data consumption is expanding rapidly in 2026, while operators face a more complex challenge: converting network usage into sustainable revenue and investment returns.
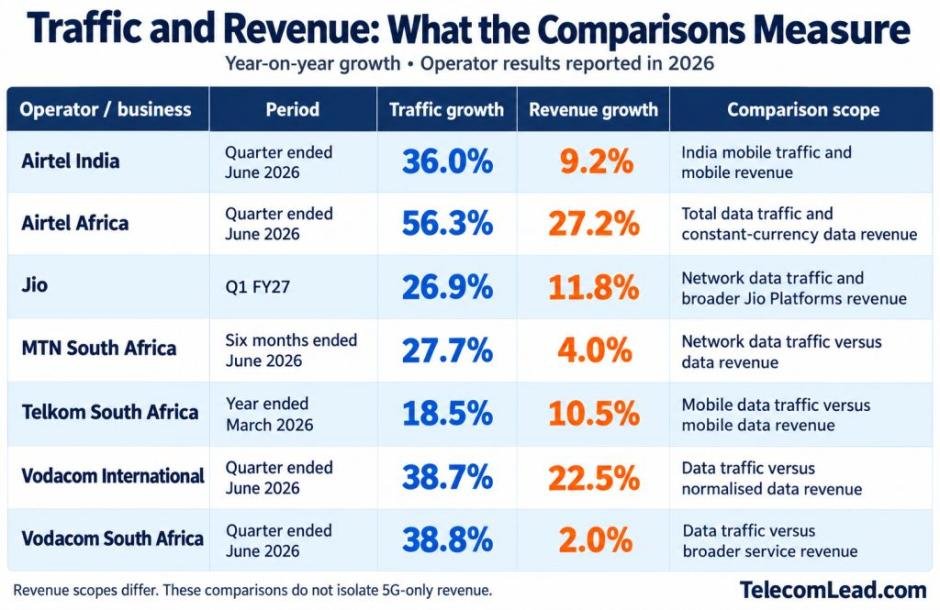
Airtel’s India mobile traffic increased 36 percent year over year in the quarter ended June 30, 2026, while mobile revenue rose 9.2 percent. Airtel Africa recorded 56.3 percent traffic growth against 27.2 percent data-revenue growth.
These comparisons illustrate the gap between usage and monetization. However, they cover total mobile data and broader service revenue, rather than separately disclosed 5G traffic and 5G revenue. They therefore help explain the commercial environment for 5G without measuring its standalone return.
Why More Gigabytes Do Not Produce Proportional Revenue
Traffic measures consumption; revenue reflects what customers pay. A subscriber can watch more video or use more cloud services within an existing allowance without increasing the monthly bill.
Under fixed-price, unlimited or high-volume plans, additional usage may generate little immediate incremental revenue. Operators instead increase revenue through customer additions, higher-value plans, additional connections and new services.
The cost relationship is also important. Network expenditure does not increase in direct proportion to every extra gigabyte. Capacity utilization, spectrum efficiency and operating improvements can help operators accommodate growth.
Consequently, slower revenue growth than traffic is not sufficient evidence of a failed 5G strategy. The commercial question is whether service revenue, operating efficiency and cash generation support the required investment.
Global 5G Adoption Provides the Context
The Ericsson Mobility Report June 2026 reports almost 3.3 billion global 5G subscriptions, with 5G carrying approximately half of global mobile data traffic.
Ericsson also reports that total mobile network data traffic increased 23 percent between Q2 2025 and Q2 2026.
Those figures describe adoption and network load. Establishing the financial impact requires operator-level information about tariffs, customer mix, service adoption and investment.
Airtel India: Traffic Up 36%, Mobile Revenue Up 9.2%
Airtel’s detailed Q1 FY27 investor pack provides a comparison within the same geography and business segment.
India mobile data traffic increased 36 percent to 31.1 billion GB. Monthly usage per data customer reached 34.4 GB, up 27.7 percent from 26.9 GB.
India mobile revenue increased 9.2 percent to ₹29,928.9 crore. ARPU reached ₹264, compared with ₹250 a year earlier.
The Airtel Q1 FY27 investor pack therefore shows traffic expanding substantially faster than revenue, alongside an improvement in customer monetization.
India mobile EBITDA margin increased to 60.8 percent from 59.4 percent. Rising usage and a traffic–revenue growth gap coexisted with stronger operating profitability.
This comparison is more informative than placing consolidated traffic growth beside India revenue, which mixes different geographic scopes.
Jio: High Consumption Alongside Improving Profitability
Jio reported 69.4 exabytes of quarterly data traffic in Q1 FY27, up 26.9 percent year over year. Monthly consumption reached 43.7 GB per subscriber, while its 5G customer base reached 285 million.
ARPU increased to ₹215.6 from ₹208.8 a year earlier.
Reliance’s Q1 FY27 financial reporting distinguishes Jio Platforms from its connectivity subsidiary, Reliance Jio Infocomm.
Jio Platforms revenue increased 11.8 percent to ₹39,173 crore. Its EBITDA grew 15.1 percent, with the EBITDA margin increasing by 150 basis points to 53.3 percent. Separately, RJIL reported operating revenue of ₹34,212 crore.
The group-level revenue figure should therefore be treated as context rather than a measure of revenue earned specifically from 5G traffic.
Jio’s performance reinforces a broader point: traffic can rise faster than revenue while operating earnings and margins improve.
Airtel Africa: Compare Traffic With Data Revenue
Airtel Africa’s quarter ended June 30, 2026 provides a more direct comparison between total data consumption and data-service revenue.
Network traffic increased 56.3 percent, while data revenue grew 27.2 percent. Its data customer base expanded 15.5 percent to 87.3 million, and data ARPU increased 10.3 percent.
Monthly usage per data customer rose to 10.6 GB from 7.8 GB.
MTN South Africa: Traffic Up 27.7%, Data Revenue Up 4%
MTN South Africa reported 27.7 percent growth in network data traffic, while data revenue increased 4 percent in the six months ended June 30, 2026. Overall service revenue grew 1.5 percent.
The MTN H1 2026 results attributed data-revenue growth to rising traffic, migration to larger bundles, increased adoption of home connectivity and higher smartphone penetration. Management is pursuing personalized offers, regional pricing and fixed wireless access expansion to improve monetization.
Telkom South Africa: Traffic Up 18.5%, Data Revenue Up 10.5%
Telkom reported 18.5 percent growth in mobile data traffic to 2,084 petabytes in the financial year ended March 31, 2026. Mobile data revenue increased 10.5 percent to R17.75 billion, while mobile service revenue rose 6.8 percent.
The Telkom FY2026 results also showed that mobile data subscribers increased 31.1 percent to almost 20 million.
Despite traffic growing faster than data revenue, the mobile business increased EBITDA by 14 percent and expanded its EBITDA margin by 2.3 percentage points to 29 percent. Telkom therefore strengthens the article’s central argument: a traffic–revenue growth gap can coexist with improving profitability.
Vodacom International: Traffic Up 38.7%, Data Revenue Up 22.5%
Vodacom’s International business, covering Tanzania, the Democratic Republic of Congo, Mozambique and Lesotho, reported 38.7 percent growth in data traffic in the quarter ended June 30, 2026.
Data revenue increased 22.5 percent on a normalised basis to approximately R2.8 billion, contributing 32.6 percent of the segment’s service revenue. Its data customer base reached 31.8 million.
The Vodacom June 2026 trading update provides a useful comparison between traffic and data revenue across the same regional business. Using normalised revenue growth reduces the distortion caused by currency movements.
Vodacom South Africa: Traffic Up 38.8%, Service Revenue Up 2%
Vodacom South Africa reported 38.8 percent growth in data traffic, compared with 2 percent growth in service revenue to R16.1 billion, in the quarter ended June 30, 2026.
This is a broader comparison because service revenue includes activities beyond mobile data. It should be labelled accordingly. The operator also reported 9.4 percent growth in prepaid data revenue, but that narrower revenue category should not be presented as a like-for-like comparison with total network data traffic.
These results show that both customer adoption and spending contributed to revenue growth. Comparing traffic only with ARPU would omit the contribution from additional customers.
The figures cover the mobile data business. They should not be interpreted as a measurement of 5G-only monetization.
Verizon and T-Mobile Illustrate Other Revenue Models
Fixed wireless access creates an opportunity to sell an additional broadband service using wireless infrastructure.
Verizon financial result indicated that it added 193,000 FWA connections and 155,000 fiber broadband connections in Q2 2026. Mobility and broadband service revenue rose 2.8 percent to approximately $23.4 billion.
These results illustrate broadband monetization, although the combined revenue figure does not isolate FWA’s contribution.
T-Mobile’s Q2 service revenue increased 9 percent to $19 billion. Postpaid average revenue per account reached $152.91, up 2 percent, with 277,000 postpaid net account additions.
The T-Mobile Q2 2026 results highlight account growth and spending as commercial measures. Acquisition effects should also be considered when assessing reported growth.
Neither operator’s figures establish a traffic–revenue gap here because corresponding traffic growth is not included.
What Operators Should Measure Next
Ericsson reports that 71 percent of FWA service providers offer 5G FWA and that commercial standalone network-slicing offerings reached 84. These are availability indicators; revenue and margins will determine their financial contribution.
Operators should assess premium-plan adoption, FWA customer growth, enterprise contract revenue, churn and the cost of serving additional traffic.
Cloud and AI infrastructure may diversify earnings, but should be evaluated separately from returns directly attributable to 5G.
The test of 5G monetization is whether additional usage supports profitable revenue growth and sustainable investment returns. Traffic, ARPU, margins and cash flow need to be assessed together.
FASNA SHABEER