
Strategy Analytics has revealed wireless operator churn, EBITDA, Capital expenditure (Capex) and Opex by region.
Phil Kendall of Strategy Analytics said the latest wireless operator benchmarking report tracks the operational and financial performance of 261 active wireless operators, which collectively account for over 80 percent of the world’s cellular subscriptions.
Clients can access the full report here
Report Summary
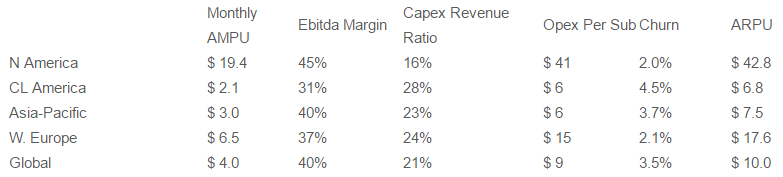
Differences by region persist in ARPU, revenue, AMPU and a host of other metrics. Strategy Analytics covers over 80 KPI on a quarterly basis for operators.
North America ARPU is 430 percent of the global average while generating over $19 of AMPU monthly.
Strategy Analytics said Capex to revenue ratios range from 16 percent in North America to almost 30 percent in some regions while global churn sits at 3.5 percent per month.
Wireless service revenue from user-linked subscriptions (excluding M2M) increased globally by 0.3 percent in 2015 and will grow by 0.6 percent in 2016 to reach $864 billion, according to another report from Strategy Analytics.