
Telecom tower companies are benefiting from 5G expansion, network densification and growing demand for shared infrastructure. However, financial performance varies significantly depending on tower tenancy, rental income, operating expenses, energy costs and capital investment.
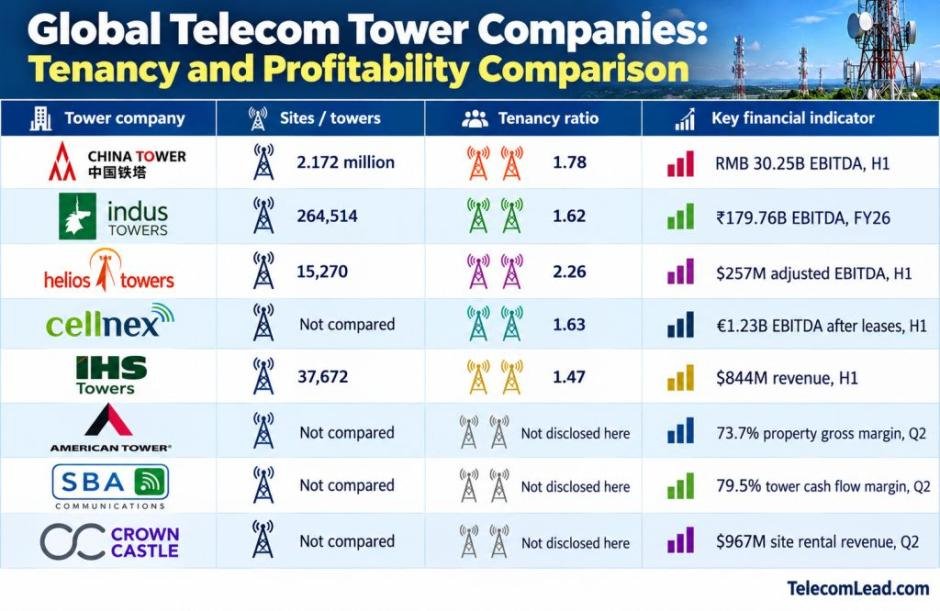
In 2026, China Tower operated 2.17 million sites, Indus Towers reported 264,514 towers, and Helios Towers achieved a tenancy ratio of 2.26. Meanwhile, SBA Communications recorded a 79.5 percent tower cash flow margin, demonstrating the earnings potential of infrastructure sharing.
The central question for telecom operators and infrastructure investors is how effectively tower companies convert their physical assets into recurring revenue and cash flow.
Figures reflect different reporting periods and accounting definitions. Margins and EBITDA measures are not directly interchangeable.
China Tower: 2.17 Million Sites and RMB 48.69 Billion Revenue
China Tower remains the largest operator in this comparison by reported site count.
During H1 2026, it operated 2.172 million sites supporting 3.871 million tenants, producing a tenancy ratio of 1.78.
Revenue reached RMB 48.69 billion, while EBITDA totaled RMB 30.25 billion, equivalent to approximately 62.1 percent of revenue. Profit attributable to shareholders reached RMB 7.49 billion.
Its business diversification included:
| Business segment | H1 2026 revenue |
| Tower business | RMB 35.26 billion |
| Distributed antenna systems | RMB 5.09 billion |
| Smart Tower services | RMB 5.33 billion |
| Energy services | RMB 2.59 billion |
Based on average reported site count, first-half revenue represents approximately RMB 22,400 per site, or RMB 3,736 monthly.
This is a simplified group-wide revenue allocation, not a disclosed tower rental tariff. It includes non-tower services.
China Tower’s scale supports infrastructure sharing across Chinese mobile operators, while Smart Tower and energy services create additional revenue opportunities.
Further financial information is available through China Tower investor relations.
Indus Towers: ₹66,995 Monthly Revenue per Tower
Indus Towers reported FY2026 revenue of ₹324.93 billion, EBITDA of ₹179.76 billion and net profit of ₹71.45 billion.
Its portfolio comprised 264,514 towers and 428,014 colocations, representing a sharing factor of 1.62.
The company reported monthly sharing revenue of ₹66,995 per tower and ₹41,302 per operator.
These figures illustrate the economic benefits of hosting multiple mobile operators on shared infrastructure.
Indus invested ₹88.17 billion in capex during FY2026, while free cash flow reached ₹37.63 billion.
Its EBITDA margin was approximately 55.3 percent, while net profit represented about 22 percent of revenue.
By June 2026, the company expanded to 267,611 towers and 432,250 colocations.
The company’s latest results are available through Indus Towers financial disclosures.
American Tower: 73.7 Percent Property Gross Margin
American Tower generated Q2 2026 property revenue of $2.69 billion, increasing 6.3 percent.
Property gross margin reached $1.98 billion, equivalent to 73.7 percent.
Adjusted EBITDA totaled $1.81 billion, representing a 65.8 percent margin on the company’s reported adjusted basis.
Operating cash flow reached $1.49 billion, while free cash flow totaled $1.16 billion after $329 million in capital expenditure.
Organic tenant billings increased 1.7 percent, while total tenant billings rose 2.4 percent.
American Tower’s results demonstrate how established infrastructure portfolios can generate substantial cash flow without relying exclusively on new tower construction.
SBA Communications: 79.5 Percent Tower Cash Flow Margin
SBA Communications reported Q2 2026 site leasing revenue of $663.9 million.
Domestic operations contributed $452.5 million, while international operations generated $211.4 million.
Tower cash flow reached $524.9 million, representing a 79.5 percent margin.
Site leasing operating profit totaled $529.8 million, including $381 million domestically and $148.8 million internationally.
International leasing revenue increased 30.5 percent, while domestic revenue declined 3.7 percent.
Capital expenditure totaled $91.2 million.
SBA’s high tower cash flow margin reflects the potential profitability of established leasing infrastructure, although the measure is not equivalent to net profit or EBITDA margin.
Review SBA Communications earnings materials for its financial reporting definitions.
Helios Towers: Highest Reported Tenancy Among Selected Operators
Helios Towers operated 15,270 sites and 34,455 tenancies in H1 2026.
Its tenancy ratio increased from 2.11 to 2.26, exceeding the reported ratios of China Tower, Cellnex, Indus Towers and IHS Towers.
Revenue increased 11 percent to $466.3 million, while adjusted EBITDA grew 14 percent to $257 million.
Operating profit reached $162.9 million, and return on invested capital improved to 14.4 percent.
Recurring free cash flow increased 52 percent to $105.8 million.
Helios Towers: Tenancy Ratios by Market
| Market | Tenancy ratio |
| Democratic Republic of Congo | 2.83 |
| Tanzania | 2.73 |
| Ghana | 2.44 |
| Congo Brazzaville | 1.75 |
| Group average | 2.26 |
Helios invested $101.7 million in discretionary capital additions during H1 2026 and reported 2,511 tenancy additions, including 524 new sites.
Its African operations illustrate how adding tenants to existing infrastructure can improve capital productivity.
Cellnex: €1.99 Billion Revenue and 1.63 Tenancy Ratio
Cellnex reported H1 2026 revenue of €1.99 billion, including €1.63 billion from tower operations.
Its tenancy ratio reached 1.63, while organic points-of-presence growth stood at 4.9 percent.
EBITDA after leases reached €1.23 billion, and free cash flow increased to €301 million.
The company secured agreements covering approximately 2,000 existing points of presence with Vodafone Spain and 300 build-to-suit sites with Sunrise in Switzerland.
These contracts support recurring rental income and additional infrastructure utilization.
IHS Towers and Crown Castle: Different Operating Models
IHS Towers operated 37,672 towers supporting approximately 55,205 tenants at June 2026, producing a colocation ratio of 1.47.
Second-quarter revenue increased 10.4 percent to $428.6 million, while first-half revenue reached approximately $844 million.
H1 capital expenditure totaled $80.6 million.
Energy generation, fuel supply and maintenance remain important operating cost considerations across its African portfolio.
Crown Castle reported Q2 2026 site rental revenue of $967 million, declining 4 percent.
Adjusted EBITDA reached $675 million, while adjusted funds from operations increased 10 percent to $488 million.
Capital expenditure totaled $59 million, including $52 million in discretionary investment.
How Tenancy Ratios Improve Tower Economics
Tenancy measures how many operators or qualifying connections share each tower.
Consider an illustrative tower with monthly rental revenue of ₹40,000 per tenant and monthly site operating costs of ₹30,000.
| Tenants per tower | Monthly revenue | Revenue less assumed site opex |
| 1 | ₹40,000 | ₹10,000 |
| 2 | ₹80,000 | ₹50,000 |
| 3 | ₹1,20,000 | ₹90,000 |
This simplified example assumes fixed operating costs. Actual costs can rise with additional tenants because of power consumption, structural upgrades and equipment requirements.
Nevertheless, additional tenants can increase tower profitability without requiring construction of a new site.
Telecom Tower Capex: India’s ₹10,000 Crore Annual Investment Outlook
India’s tower industry is projected to invest approximately ₹10,000 crore annually during FY2027 and FY2028, according to CRISIL Ratings research.
Industry tenancy growth is expected at 5–6 percent, with return on capital employed potentially increasing from approximately 14 percent to 17 percent.
Capital investment requirements vary considerably between new rural towers, urban rooftop sites, structural upgrades and additional equipment installations.
Tower operators must also account for land leases, electricity, diesel generators, batteries, fiber backhaul and site maintenance.
Which Tower Companies Have Stronger Economics in 2026?
The comparison highlights three distinct strengths.
Infrastructure scale: China Tower and Indus Towers operate exceptionally large portfolios, supporting substantial recurring rental revenue.
Tenancy density: Helios Towers leads the selected operators with disclosed comparable tenancy figures, reflecting extensive infrastructure sharing in several African markets.
Operating cash generation: SBA Communications and American Tower report strong tower-level cash margins, while Cellnex and Indus Towers generate substantial EBITDA from established infrastructure portfolios.
For tower companies, the most important profitability drivers remain higher tenancy, predictable rental contracts, controlled energy expenses, disciplined capex and stronger free cash flow.
As 5G Advanced, fiber connectivity and AI-driven network capacity requirements increase, operators that add tenants and equipment to existing sites efficiently may achieve stronger returns than those relying primarily on new tower construction.
FASNA SHABEER