
Telecom operators are under pressure to reduce network operating costs as 5G traffic expands, energy expenses rise and infrastructure investments continue.
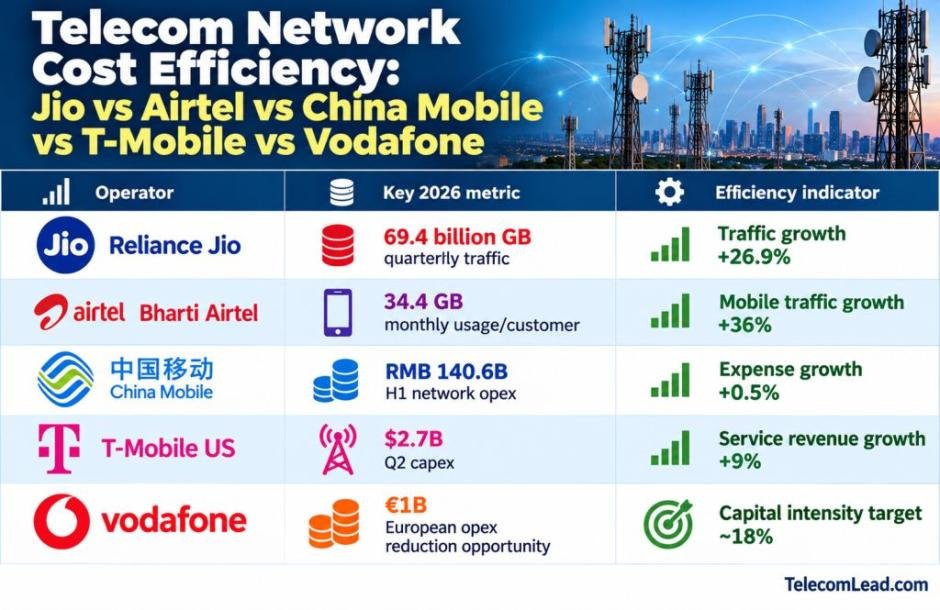
In 2026, Reliance Jio carried 69.4 billion GB of quarterly data traffic, Bharti Airtel reported 34.4 GB monthly usage per customer, and China Mobile incurred RMB 140.6 billion in first-half network operation and support expenses.
Meanwhile, T-Mobile US invested $2.7 billion in quarterly network infrastructure, and Vodafone identified a €1 billion European operating cost reduction opportunity.
These figures highlight five different approaches to telecom network efficiency: increasing traffic utilization, improving ARPU, controlling network operating expenses, optimizing capex and using automation.
The figures measure different aspects of efficiency. They are not directly comparable network costs per GB.
Reliance Jio: 69.4 Billion GB Traffic Improves Network Utilization
Reliance Jio reported 69.4 billion GB of data traffic during the June 2026 quarter, increasing 26.9 percent year over year.
Average monthly consumption reached 43.7 GB per customer, reflecting growing demand for 5G video streaming, digital services and broadband connectivity.
Jio’s subscriber base reached approximately 533 million, including 285 million 5G subscribers. The operator added 73 million 5G subscribers over 12 months.
Its fixed broadband connections increased to 28.6 million, including more than 14 million AirFiber customers.
AirFiber contributed over 75 percent of fixed broadband additions during the preceding year.
Monthly ARPU reached ₹215.6, supporting revenue growth alongside rising data consumption.
Jio’s Traffic Growth and Cost Efficiency
Assuming unchanged network operating costs, a 26.9 percent increase in traffic would reduce the average operating cost per GB by approximately 21.2 percent.
For example, if network operating expenditure remained ₹10,000 crore while traffic increased from 54.7 billion GB to 69.4 billion GB, the illustrative cost per GB would decline from approximately ₹1.83 to ₹1.44.
This is a mathematical scenario, not Jio’s reported cost per GB. Actual network costs may rise with additional traffic, sites and energy consumption.
Jio’s financial and operating disclosures are available through Reliance Industries investor information.
Bharti Airtel: 36% Traffic Growth and Higher ARPU
Bharti Airtel reported average monthly mobile data consumption of 34.4 GB per customer in the June 2026 quarter.
Total mobile data consumption increased 36 percent year over year.
India mobile ARPU increased from ₹250 to ₹264, representing 5.6 percent growth.
Smartphone data customers increased by 21.1 million year over year and 5 million sequentially, accounting for approximately 80 percent of the mobile customer base.
Airtel also added 1 million postpaid subscribers during the quarter, its highest quarterly addition.
India capex reached ₹9,698 crore, while consolidated capex totaled ₹13,386 crore.
Airtel’s Revenue Recovery Strategy
Airtel’s approach combines rising network utilization with higher customer revenue.
For example, 10 million customers generating ₹264 monthly ARPU would contribute ₹264 crore in monthly revenue, compared with ₹250 crore at ₹250 ARPU.
That represents ₹14 crore in additional monthly revenue, assuming an unchanged subscriber base and revenue mix.
Higher ARPU can help recover investment in spectrum, towers, fiber backhaul and 5G equipment.
However, traffic growth alone does not establish whether Airtel’s actual network operating cost per GB declined.
See Bharti Airtel’s quarterly financial results.
China Mobile: Network Expenses Rise Just 0.5% Against 16% Traffic Growth
China Mobile provides one of the clearest examples of cost control among major telecom operators.
During H1 2026, network operation and support expenses reached RMB 140.6 billion, increasing only 0.5 percent year over year.
Meanwhile, handset data traffic increased approximately 16 percent.
Network operation and support expenses represented 26.2 percent of operating revenue.
China Mobile Network Operating Cost Breakdown
| Expense category | H1 2026 |
| Network operation and support | RMB 140.6B |
| Business support expenses | RMB 78.91B |
| Energy expenses | RMB 21.72B |
| Network maintenance | RMB 18.45B |
| Tower-related charges | RMB 10.37B |
| Circuits and network assets | RMB 8.01B |
| Depreciation and amortization | RMB 95.37B |
The five listed support-cost components total RMB 137.46 billion, with other items accounting for the remaining difference.
China Mobile generated RMB 538.04 billion in operating revenue and served approximately 1.011 billion mobile customers, including 687 million 5G network customers.
Its network included approximately 2.94 million 5G base stations.
How Much Did China Mobile Improve Cost Efficiency?
If the network expense category and handset traffic were directly comparable, the ratio of expense to traffic would change by:
1.005 ÷ 1.16 − 1 = −13.4 percent.
This suggests a 13.4 percent improvement in the expense-to-traffic ratio.
However, China Mobile’s network expense category also supports broadband, enterprise and other services. The calculation is therefore an indicative efficiency measure, not an audited mobile network cost-per-GB reduction.
T-Mobile US: $2.7 Billion Capex Supports 5G Capacity
T-Mobile US reported $2.7 billion in cash purchases of property and equipment, including capitalized interest, during Q2 2026, increasing 13 percent.
The operator expects approximately $10 billion in annual capex, supporting 5G capacity expansion, network integration and technology modernization.
Quarterly service revenue increased 9 percent to $19 billion, while postpaid service revenue grew 13 percent to $15.9 billion.
Operating cash flow reached $7.5 billion, increasing 7 percent.
Adjusted free cash flow increased 4 percent to $4.8 billion.
T-Mobile’s quarterly infrastructure expenditure represented approximately 14.2 percent of its reported service revenue.
This is a simplified investment-intensity calculation, not a company-reported capex-to-revenue ratio, because equipment and other revenue are excluded from the denominator.
T-Mobile’s efficiency strategy depends on converting infrastructure investment into higher network capacity, customer growth and recurring service revenue.
Vodafone: €1 Billion European Cost Reduction Opportunity
Vodafone reported 5.2 percent organic service revenue growth during its June 2026 quarter.
Germany’s service revenue increased 1.2 percent, while African operations delivered 12.6 percent organic growth.
Vodafone identified approximately €2 billion in gross efficiency and synergy potential, including a €1 billion net European operating cost reduction opportunity over FY2027–FY2030.
The operator targets capital intensity of approximately 18 percent.
Network integration, infrastructure sharing and operating-model simplification are important elements of its efficiency strategy.
Vodafone’s AI Customer Service Example
Vodafone Germany’s GenAI-enabled Ask Once initiative reduced customer detractors by approximately 20 percent.
Although this demonstrates operational improvement, it is not a quantified network opex saving.
AI-assisted customer operations may reduce service handling requirements and improve customer experience, but financial benefits should be distinguished from radio-network operating cost reductions.
Vodafone’s financial disclosures are available through its investor reports.
What Drives Telecom Network Cost per GB?
Network cost efficiency depends on several operating factors beyond total data traffic.
Energy efficiency: More efficient radio equipment, cooling systems and site power management can reduce electricity and diesel expenditure.
Tower sharing: Multiple operators using common tower infrastructure can reduce site-related capital and operating costs.
Fiber backhaul: High-capacity fiber can support growing 5G traffic and reduce dependence on capacity-constrained transmission links.
AI and automation: Predictive maintenance, intelligent energy management and automated fault resolution can reduce manual intervention and improve asset utilization.
Higher ARPU: Improved customer revenue can strengthen network investment recovery even when absolute network costs continue increasing.
Which Telecom Operator Demonstrates Stronger Network Efficiency?
The available 2026 figures show different strengths.
China Mobile reported the clearest relationship between traffic growth and network expense control, with 16 percent handset traffic growth against just 0.5 percent network operation and support expense growth.
Jio and Airtel demonstrate rapidly increasing network utilization, with traffic growth of 26.9 percent and 36 percent, respectively.
T-Mobile US continues investing in 5G infrastructure while expanding service revenue, whereas Vodafone is pursuing a measurable European operating cost reduction programme.
For telecom CTOs and CFOs, the most useful network efficiency indicators are operating cost per GB, energy cost per site, revenue per customer, capex intensity and free cash flow after network investment.
Comparing these measures consistently will become important as operators finance 5G Advanced, fiber expansion and AI-enabled network automation.
FASNA SHABEER