
Japan’s mobile network performance in Q3 2025 highlights clear differences between overall network experience and pure 5G performance, according to Speedtest Intelligence data.
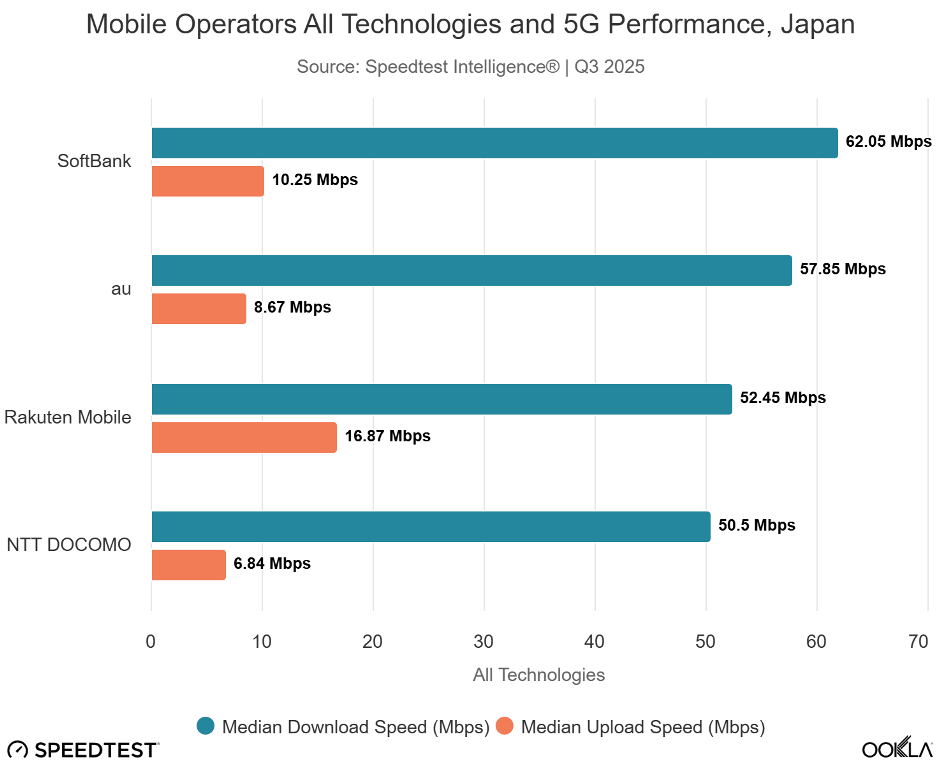
SoftBank emerged as the top operator in download speed across all mobile technologies combined, reaching 62.05 Mbps, narrowly ahead of au at 57.85 Mbps. SoftBank’s leadership reflects investment in network modernization, optimization, and capacity upgrades aimed at delivering more consistent and reliable nationwide performance. Rakuten Mobile and NTT DOCOMO followed, recording download speeds of 53.54 Mbps and 50.50 Mbps, respectively.
In terms of 5G performance, Rakuten Mobile took the lead in Q3 2025, despite ranking third overall across all technologies. Rakuten posted a strong 5G download speed of 128.39 Mbps and upload speed of 22.34 Mbps, reflecing the effectiveness of its newer, cloud-native network architecture and targeted 5G deployment strategy.
SoftBank ranked second in 5G performance, delivering 5G download speed of 127.45 Mbps and an upload speed of 17.51 Mbps. The data shows that while SoftBank offers the best blended network experience in Japan, Rakuten Mobile currently leads in pure 5G speeds, highlighting how different network strategies are shaping competitive performance in the Japanese mobile market.
Japan’s mobile market is one of the most saturated in the world, with around 194 million cellular connections and a penetration rate of 157 percent as of early 2025. In this near-universal adoption environment, competition among operators is driven less by subscriber growth and more by quality of service, network speed, and next-generation connectivity. According to the Ministry of Internal Affairs and Communications, nationwide 5G population coverage reached 98.4 percent by the end of fiscal year 2024, reflecting extensive investment by all major operators.
NTT DOCOMO remains the largest operator in Japan with approximately 91.4 million mobile subscribers as of early 2025, representing around 39.9 percent market share. DOCOMO has continued to invest heavily in network expansion and modernization. In fiscal year 2024, DOCOMO’s standalone mobile unit spent around ¥714 billion (about US$4.9 billion) on capital expenditures, with plans to increase spending by roughly 23 percent in 2025 to support expanded 5G deployments, including boosting urban base station density by about 20 percent. NTT Group’s capital investment plan for FY2025 reaches ¥2.13 trillion, with significant funding also directed toward strategic acquisitions and digital infrastructure.
KDDI (au) holds about 31.2 percent of the market with roughly 70.3 million subscribers, making it the second-largest operator. KDDI has been actively partnering with SoftBank through a joint venture to build shared 5G infrastructure, achieving significant Capex savings — an estimated ¥45 billion in cost reductions between FY2020 and FY2023 — and targeting further savings up to ¥120 billion by FY2030. While KDDI’s heavy 5G investment phase has peaked, the operator is diversifying into enterprise solutions, AI, and data center services supported by its existing fiber and mobile assets.
SoftBank has about 24.8 percent market share with around 54.8 million subscribers, placing it third among Japan’s major carriers. On the investment front, SoftBank collaborates closely with KDDI through the 5G JAPAN JV to extend 5G coverage while minimizing costs. SoftBank’s broader capital strategy also reflects major global investments in technology infrastructure, though domestic network Capex has been prudent compared with peers.
Rakuten Mobile, Japan’s challenger operator, holds a smaller but growing position with about 8.6 million subscribers (roughly 4.1 percent market share). Rakuten has made aggressive investments to build its cloud-native 4G/5G network from scratch, spending approximately ¥168 billion in 2023 and ¥81 billion in 2024, with plans to raise Capex to around ¥150 billion in 2025 to sustain growth and broaden coverage. Cumulatively, Rakuten has invested an estimated ¥1.8 trillion (about US$11.8 billion) in its mobile infrastructure since launch, positioning itself for future expansion.
Ookla Speedtest Intelligence data from Q3 2025 shows that 4G networks continue to deliver near-ubiquitous coverage across Japan, with Network Availability scores clustered above 97 percent for all leading carriers. In contrast, 5G Availability, which measures the percentage of time users with 5G-capable devices are connected to a 5G network, varies significantly by operator. NTT DOCOMO led the market with 38.4 percent 5G Availability, outperforming au by nearly six percentage points. SoftBank recorded the lowest 5G Availability at 26.5 percent, despite delivering the fastest median download speeds across all technologies. This reflects a strategic trade-off shaped by Japan’s geography, where operators prioritize mid-band 5G capacity and speed in dense urban centers while relying on extensive 4G networks to ensure nationwide coverage.
Geography and population distribution play a decisive role in shaping Japan’s 5G footprint. Although more than 92 percent of the population lives in urban areas, operators must still cover geographically complex and sparsely populated regions. Regulatory obligations set by the MIC require 5G coverage across all 47 prefectures, driving investment beyond major cities. As a result, Speedtest Intelligence data reveals wide disparities in 5G Availability at the prefectural level. Availability ranges from a high of 35.2 percent in Osaka to just 9.1 percent in Yamanashi, meaning users in the lowest-ranking prefecture are nearly four times less likely to access 5G than those in the highest.
Prefectures with the highest 5G Availability align with Japan’s most populous and economically significant regions. Osaka, Tokyo, Aichi, and Kanagawa lead the market, reflecting dense site deployment, stronger spectrum strategies, and a focus on high-value urban customers. In contrast, inland and mountainous prefectures such as Yamanashi and Nagano recorded the lowest 5G Availability, highlighting the economic and technical challenges of deploying advanced networks in low-density and difficult terrain. In these areas, operators continue to rely heavily on established 4G infrastructure.
The regional digital divide is further reinforced by differences in median 5G download speeds. Urban prefectures not only benefit from higher 5G Availability but also faster speeds. Osaka recorded a median 5G download speed of 172 Mbps alongside 35.2 percent Availability, while Tokyo achieved 128 Mbps with 33.7 percent Availability, reflecting substantial infrastructure investment. However, some regions deviate from this pattern. Yamagata, for example, recorded Japan’s highest median 5G download speed at 181 Mbps despite relatively low 5G Availability of 13.9 percent. This suggests limited network congestion in sparsely populated areas, where 5G infrastructure has been deployed to meet regulatory requirements but serves a smaller user base.
An analysis of 10th percentile 5G download speeds across Japan’s 47 prefectures in Q3 2025 provides critical insight into minimum network performance, reflecting the real-world experience of the bottom 10 percent of users. This metric is a key indicator of service reliability at the cell edge and during periods of congestion.
Speedtest Intelligence data shows that NTT DOCOMO delivered stronger minimum performance nationwide, recording the highest or near-highest 10th percentile download speeds across the widest range of prefectures, with peak results reaching 41 Mbps in Ishikawa.
SoftBank, however, achieved the single highest minimum 10th percentile speed overall, hitting 49 Mbps in Aomori, although its performance varied sharply by region, falling as low as 4 Mbps in Nagano and 6 Mbps in Chiba. In comparison, au and Rakuten Mobile posted lower and more tightly clustered minimum speeds, indicating greater vulnerability in challenging network conditions.
The data highlights a strong relationship between minimum 5G performance and urbanization. Highly urbanized prefectures and regional capitals consistently reported higher 10th percentile download speeds across all operators, supported by higher site density and targeted mid-band spectrum deployment. Osaka is a clear example, where all operators recorded relatively narrow minimum speed ranges between 18 Mbps and 28 Mbps, reflecting more uniform user experiences in dense metropolitan environments.
Speedtest Intelligence data also reveals a positive correlation between median 5G download speeds and the 5G Consistency Score across Japan. Ookla’s 5G Consistency metric measures the proportion of user samples meeting or exceeding 25 Mbps download and 3 Mbps upload, a threshold aligned with high-quality use cases such as 4K video streaming. Prefectures with higher median 5G speeds consistently showed a higher likelihood of delivering reliable service.
SoftBank led in 5G Consistency across many prefectures, particularly in Hokkaido and the Tōhoku region. Aomori and Nagasaki both recorded 90.9 percent consistency, while Iwate reached 90.7 percent. NTT DOCOMO and au also demonstrated solid consistency, reflecting the benefits of their mature and well-optimized network infrastructures.
Despite Japan’s success in achieving near-universal 5G population coverage through proactive regulation and heavy operator investment, significant regional performance disparities remain. The highest 5G Consistency scores were concentrated in the Chūgoku and Shikoku regions, while lower scores were more common in rural and geographically challenging areas such as northern Kanto, including Ibaraki, Gunma, and Tochigi. The findings underscore a clear urban–rural performance gap driven by deployment economics and terrain challenges. To meet Japan’s 2030 digital connectivity goals and ensure consistently high-quality 5G experiences across all prefectures, continued targeted infrastructure investment and the strategic adoption of technologies such as Non-Terrestrial Networks will be essential to bridging the remaining digital divide.
Baburajan Kizhakedath