
5G Fixed Wireless Access (FWA) is becoming an important broadband growth opportunity for telecom operators, but profitability depends on customer acquisition costs, equipment subsidies, network capacity and subscriber retention. Verizon, AT&T, T-Mobile, Reliance Jio and Bharti Airtel are expanding wireless broadband services while managing the cost of connecting millions of households.
Unlike fiber broadband, FWA can use existing 5G radio infrastructure to deliver home internet without building a dedicated fiber connection to every customer.
However, customer premises equipment (CPE), installation, marketing, network upgrades and rising data consumption can reduce margins.
The critical financial question is how quickly an operator can recover its investment in each FWA customer.
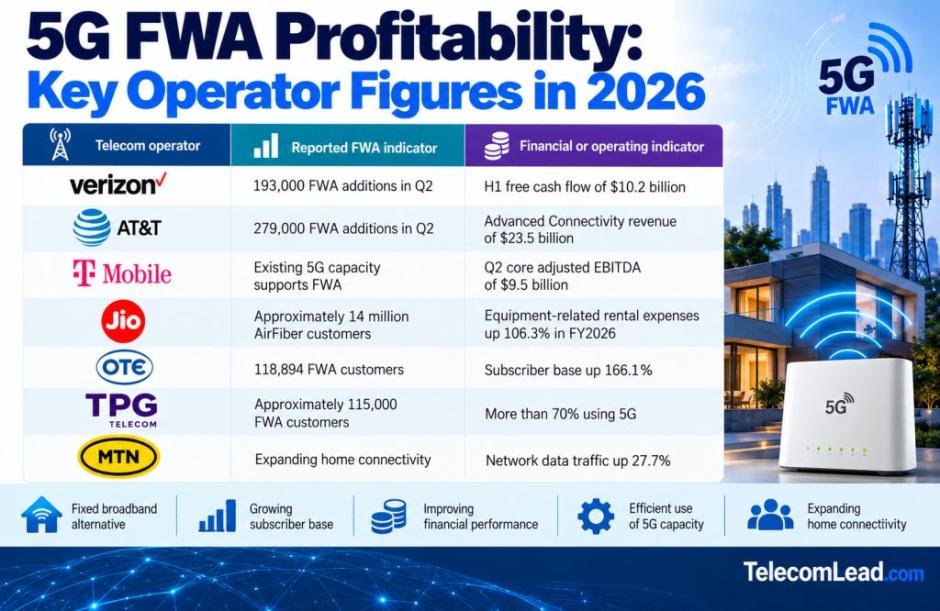
5G FWA Profitability: Key Operator Figures in 2026
| Telecom operator | Reported FWA indicator | Financial or operating indicator |
| Verizon | 193,000 FWA additions in Q2 | H1 free cash flow of $10.2 billion |
| AT&T | 279,000 FWA additions in Q2 | Advanced Connectivity revenue of $23.5 billion |
| T-Mobile | Existing 5G capacity supports FWA | Q2 core adjusted EBITDA of $9.5 billion |
| Reliance Jio | Approximately 14 million AirFiber customers | Equipment-related rental expenses up 106.3% in FY2026 |
| OTE Greece | 118,894 FWA customers | Subscriber base up 166.1% |
| TPG Telecom | Approximately 115,000 FWA customers | More than 70% using 5G |
| MTN South Africa | Expanding home connectivity | Network data traffic up 27.7% |
These indicators reflect different reporting periods and business segments. Company-wide financial results should not be interpreted as FWA-specific profitability.
Verizon: FWA Adds 193,000 Customers
Verizon added 193,000 FWA customers in Q2 2026, compared with 155,000 fiber broadband additions.
Combined broadband additions reached 348,000, increasing 12.3 percent year over year.
Mobility and broadband service revenue increased 2.8 percent to $23.4 billion.
According to Verizon’s Q2 2026 financial results, first-half capital expenditure reached $8.2 billion, while free cash flow increased 16 percent to $10.2 billion.
Verizon expects full-year capital expenditure of $16 billion–$16.5 billion.
Its FWA economics benefit when additional broadband subscribers can be served using available mobile network capacity.
For example, an existing 5G cell site with sufficient spare capacity may support new home broadband connections without immediate radio equipment investment.
However, higher household data consumption can eventually require network densification, additional spectrum capacity or backhaul upgrades.
AT&T: 279,000 FWA Additions and Converged Customer Growth
AT&T reported 279,000 FWA additions and 367,000 fiber additions in Q2 2026.
Advanced Connectivity service revenue increased 5.1 percent to $23.5 billion, while operating income rose 20.3 percent to $7.3 billion.
According to AT&T’s Q2 2026 earnings report, 42.5 percent of advanced home internet households also subscribed to its wireless services.
This convergence creates opportunities to reduce customer acquisition costs and improve retention through bundled mobile and broadband relationships.
AT&T expects annual capital investment of $23 billion–$24 billion during 2026–2028.
Its strategy combines fiber expansion with FWA, allowing the operator to address different customer segments.
However, the reported financial figures cover broader operations and do not establish the profitability of individual FWA connections.
T-Mobile: Existing 5G Capacity Supports Broadband Margins
T-Mobile reported Q2 2026 service revenue of $19 billion, increasing 9 percent year over year.
Core adjusted EBITDA reached $9.5 billion, up 12 percent.
Operating cash flow totaled $7.5 billion, while adjusted free cash flow reached $4.8 billion.
T-Mobile’s FWA model uses its existing 5G network to provide broadband services without constructing a dedicated last-mile fiber connection.
The potential financial advantage is lower incremental infrastructure spending where spare network capacity exists.
However, profitability depends on controlling the amount of capacity consumed by home broadband subscribers.
As FWA traffic increases, additional radio, transport and network investments may become necessary.
Reliance Jio: 14 Million AirFiber Customers Increase Equipment Requirements
Reliance Jio expanded its AirFiber customer base to approximately 14 million by June 2026.
This scale makes Jio an important participant in the global FWA market.
However, rapid subscriber acquisition also creates equipment and distribution expenses.
Jio Platforms’ FY2026 equipment-related rental expenses increased 106.3 percent from ₹18.94 billion to ₹39.07 billion.
Selling and distribution expenses increased 23.5 percent from ₹36.95 billion to ₹45.65 billion.
These expenses cover broader business activities and cannot be attributed entirely to AirFiber.
The company’s October 2026 prospectus filed with SEBI provides additional financial and operating disclosures.
Jio’s profitability opportunity lies in achieving sufficient customer scale while controlling equipment procurement, installation and network capacity costs.
For example, standardised customer equipment and efficient installation processes can reduce the cost of activating additional households.
Bharti Airtel: Customer Acquisition and Retention Matter
India’s fixed wireless access subscriptions increased from 18.84 million in July to 19.34 million in August 2026.
This represents approximately 2.65 percent monthly growth.
The figures cover the broader FWA category rather than a single operator’s 5G subscriber base.
For Bharti Airtel, profitability depends on balancing customer acquisition costs with recurring broadband revenue.
CPE subsidies, promotional discounts and installation expenses increase upfront investment.
Airtel must also consider whether wireless broadband subscribers consume capacity that could otherwise support mobile customers.
Lower customer churn and higher monthly contribution margins can improve FWA investment returns.
OTE and TPG Telecom: FWA Growth Beyond India and the US
Greece’s OTE reported 118,894 FWA customers in Q2 2026, increasing 166.1 percent from 44,683 a year earlier.
Quarterly additions reached 18,663.
OTE also reported 686,831 FTTH customers, representing 46 percent annual growth.
The results illustrate how operators can expand wireless and fiber broadband simultaneously.
Australia’s TPG Telecom reported approximately 115,000 FWA subscribers during H1 2026, with more than 70 percent using 5G.
For both operators, financial returns depend on acquisition costs, customer lifetime and the incremental network capacity required to support home broadband usage.
MTN: Data Traffic Growth Creates Capacity Cost Pressure
MTN South Africa reported 27.7 percent growth in network data traffic during H1 2026, compared with 4 percent growth in data revenue.
Average monthly usage among active postpaid data subscribers increased 32 percent to 32.3 GB.
FWA adoption contributed to growing demand for home connectivity.
The gap between traffic growth and revenue growth highlights a major profitability challenge.
When data consumption rises faster than revenue, operators must improve network efficiency to protect margins.
This does not necessarily mean FWA is unprofitable, but it reinforces the importance of measuring the cost of additional network capacity.
5G FWA Equipment Market: 23 Million CPE Shipments Forecast
The Global mobile Suppliers Association forecasts 23 million FWA CPE shipments worldwide in 2026, representing 16 percent annual growth.
Of these, 16 million devices are expected to support 5G, accounting for 69 percent of total shipments.
| FWA equipment indicator | 2026 forecast |
| Total FWA CPE shipments | 23 million |
| Annual shipment growth | 16% |
| 5G-enabled CPE shipments | 16 million |
| 5G share of shipments | 69% |
| 5G Standalone-capable CPE growth | 34% |
According to the GSA’s September 2026 FWA equipment survey, North America accounted for 28 percent of reported shipments in 2025, followed by Africa at 21 percent.
India and North America recorded 5G-capable equipment shares of 99 percent and 97 percent respectively.
Higher shipment volumes can create opportunities for equipment suppliers, although they do not automatically establish lower unit costs for operators.
5G FWA Cost per Connection and Customer Acquisition Payback
FWA connection investment typically includes customer equipment, installation, marketing, activation and subsidies.
A simple customer acquisition payback calculation is:
Payback period = Initial acquisition and activation investment ÷ Monthly contribution margin
Monthly contribution margin represents recurring customer revenue after directly attributable operating costs.
| Illustrative scenario | Initial investment | Monthly contribution | Simple payback |
| Low acquisition cost | $300 | $20 | 15 months |
| Higher acquisition cost | $450 | $20 | 22.5 months |
| Lower monthly margin | $450 | $15 | 30 months |
| Improved contribution | $300 | $25 | 12 months |
These are illustrative scenarios, not reported operator-specific FWA costs.
For example, reducing acquisition investment from $450 to $300 improves payback from 22.5 months to 15 months when monthly contribution remains $20.
Similarly, increasing monthly contribution from $15 to $20 reduces payback on a $450 connection from 30 months to 22.5 months.
These calculations exclude financing, customer churn, taxes and incremental network infrastructure investment.
5G FWA vs Fiber: Which Is More Profitable?
FWA generally requires less initial last-mile construction when sufficient mobile network capacity is already available.
Fiber requires greater upfront infrastructure investment but can support sustained high-volume broadband traffic without consuming mobile radio capacity.
For FWA, profitability improves when operators achieve low equipment costs, efficient installation, strong monthly margins and long customer lifetimes.
For fiber, long-term economics depend on construction cost, premises passed, customer take-up and network utilisation.
The appropriate technology therefore depends on geography, subscriber density, traffic demand and existing infrastructure.
5G FWA Profitability Outlook for 2026
Verizon, AT&T, T-Mobile, Reliance Jio, Bharti Airtel, OTE, TPG Telecom and MTN demonstrate that FWA is becoming an important part of broadband expansion strategies.
However, subscriber growth alone does not establish profitability.
Operators must evaluate acquisition spending, monthly contribution margins, customer retention, CPE replacement and incremental radio network investment.
The strongest FWA business models are those that convert available 5G capacity into recurring broadband revenue without triggering disproportionate infrastructure costs.
As FWA adoption expands, customer acquisition payback and cost per connection will become important measures of broadband investment efficiency.
FASNA SHABEER

