

Connecticut, New Jersey and North Dakota are leading U.S. fixed broadband performance in 2026, while Starlink has recorded a major improvement in delivering 100 Mbps download and 20 Mbps upload speeds, according to the latest Ookla Speedtest Intelligence data.

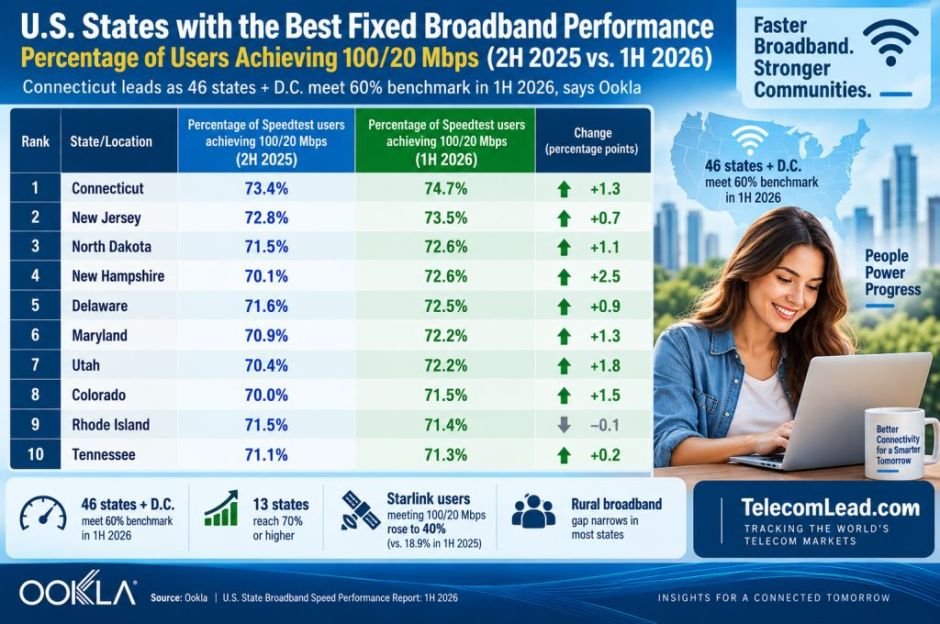
Broadband performance across the United States improved substantially during the first half of 2026, although the strongest fixed broadband markets are beginning to show signs of reaching a performance plateau.
Ookla’s analysis measures the percentage of Speedtest users receiving at least 100 Mbps download and 20 Mbps upload, the Federal Communications Commission’s minimum benchmark for broadband.
The performance picture has changed in two years. In the first half of 2024, only 10 states delivered 100/20 Mbps fixed broadband performance to at least 60 percent of Speedtest users. By the first half of 2026, 46 states plus Washington, D.C. crossed the 60 percent mark.
Another 13 states delivered the 100/20 Mbps benchmark to at least 70 percent of users.
Connecticut Leads US Fixed Broadband Performance
Connecticut ranked first for fixed broadband performance, with 74.7 percent of Speedtest users achieving at least 100/20 Mbps during 1H 2026, up from 73.4 percent in 2H 2025.
New Jersey was second at 73.5 percent, followed by North Dakota and New Hampshire at 72.6 percent each.
Delaware reached 72.5 percent, while Maryland and Utah recorded 72.2 percent. Colorado reached 71.5 percent, Rhode Island 71.4 percent and Tennessee 71.3 percent.
Florida reached 71 percent, Texas 70.5 percent and Kansas 70.2 percent.
The results indicate that the leading U.S. broadband markets are entering a more mature phase. Connecticut, for example, improved by only 1.3 percentage points, while New Jersey gained just 0.7 points.
For telecom operators, this suggests the competitive battle in mature broadband markets will shift from basic speed availability toward network reliability, latency, Wi-Fi performance, multi-gigabit tiers and customer experience.
Maine Records Biggest Fixed Broadband Performance Gain
The most significant changes occurred further down the rankings.
Maine recorded one of the strongest improvements, with the percentage of users reaching 100/20 Mbps rising from 57.6 percent in 2H 2025 to 63 percent in 1H 2026.
Vermont increased from 63.2 percent to 67.5 percent, while Wisconsin improved from 54.9 percent to 59.2 percent.
Wyoming reached 58.2 percent, compared with 53.8 percent previously.
The results underline how ongoing fiber construction and network upgrades are beginning to improve broadband performance outside the largest metropolitan markets.
AT&T, for example, added 5.1 million locations to its fiber footprint during the first half of 2026, including around 4 million locations obtained through its acquisition of Lumen’s mass-market fiber business.
Verizon is estimated to have added around 500,000–600,000 locations during the same period and is targeting roughly 2 million additions for 2026.
MetroNet now passes more than 2 million homes across 18 states, while Brightspeed said in April that it had surpassed 3 million new fiber passes across underserved markets.
These deployments demonstrate why fiber broadband investment and network modernization remain important components of U.S. telecom capex even as broadband penetration approaches saturation in major cities.
Four States Remain Below 60% Broadband Performance
Despite nationwide improvement, four states remained below the 60 percent performance threshold: Wisconsin, Wyoming, Montana and Alaska.
Wisconsin reached 59.2 percent and Wyoming 58.2 percent.
Montana stood at 52.5 percent, while Alaska ranked last at 43.5 percent.
Alaska presents particularly difficult network economics because of its enormous geographic area, low population density, difficult terrain and high fiber deployment costs.
Wisconsin faces a different challenge. Broadband performance is significantly stronger around cities such as Milwaukee and Madison, while many agricultural and forest communities continue to depend on older infrastructure.
The numbers demonstrate that the remaining U.S. broadband challenge is increasingly about where high-performance networks are available, rather than simply increasing national broadband penetration.
Washington Has Largest Urban-Rural Broadband Performance Gap
The performance difference between urban and rural broadband remains substantial in several states.
Washington recorded the largest digital divide. About 76 percent of urban Speedtest samples achieved 100/20 Mbps, compared with only 50.3 percent of rural samples, creating a 25.8 percentage-point gap.
Illinois followed with a 23.1-point gap, as 77.7 percent of urban users achieved the benchmark compared with 54.6 percent of rural users.
New Mexico recorded a 21.9-point gap, Oregon 20.6 points and Missouri 20.2 points.
By comparison, Delaware demonstrates what broadband saturation can look like. Around 79.3 percent of urban users and 78.4 percent of rural users achieved the benchmark, leaving a gap of just 0.9 percentage points.
Closing these gaps represents one of the largest remaining opportunities for fiber, fixed wireless access and satellite broadband providers.
Starlink Performance More Than Doubles
One of the biggest performance developments in the Ookla data comes from Starlink.
In 1H 2025, only 18.9 percent of U.S. Starlink Speedtest users achieved 100/20 Mbps. By 1H 2026, that figure had increased to 40 percent.
The number of states where at least half of Starlink users achieved the FCC broadband benchmark also increased sharply.
No state crossed 50 percent in 1H 2025. Five states reached that level in 2H 2025. By 1H 2026, the number had risen to 17 states.
This represents an important performance improvement for satellite broadband, although Starlink continues to trail fixed broadband nationally.
South Dakota Leads Starlink Broadband Performance
South Dakota was the strongest state for Starlink performance, with 58.2 percent of Speedtest users achieving at least 100/20 Mbps.
That compares with just 37.1 percent in 1H 2025.
Nebraska ranked second at 57 percent, followed by Colorado at 56.7 percent, Wyoming at 55.9 percent and Minnesota at 55 percent.
Utah reached 54.2 percent, while North Dakota, Delaware and New Jersey each recorded 54 percent.
Idaho and Maine reached 53.4 percent, while Illinois reached 53.2 percent.
At the other end of the ranking, Alaska recorded only 24.6 percent, Mississippi 24.8 percent, Louisiana 24.9 percent and Arkansas 25.1 percent.
Large Starlink markets also showed considerably lower performance than the Great Plains leaders. California reached 42.8 percent, Texas 31.4 percent and Florida 30.9 percent.
Ookla’s Sue Marek noted that California, Texas, Florida, Arizona and Washington have some of the largest Starlink Speedtest sample volumes, indicating significantly greater subscriber loads and therefore greater potential for network congestion.
Illinois Shows Impact of Starlink Capacity Expansion
Illinois offers a useful example of Starlink’s performance improvement.
The proportion of Starlink Speedtest users reaching 100/20 Mbps increased from 43.2 percent in 2H 2025 to 53.2 percent in 1H 2026, a gain of 10 percentage points in six months.
The improvement coincides with SpaceX’s expansion of its Generation 2 satellite infrastructure. Its V2 Mini satellites provide substantially more downlink and uplink capacity than first-generation satellites.
SpaceX has also expanded ground infrastructure and introduced newer customer equipment, helping Starlink address one of its historical performance challenges: delivering sufficiently strong upload speeds alongside high download throughput.
Fixed Broadband and Starlink Are Solving Different Performance Problems
The 2026 results reveal two distinct phases of the U.S. broadband market.
Fixed broadband is reaching maturity in many urban and suburban markets. With 46 states and Washington, D.C. above the 60 percent threshold, further improvements are likely to become increasingly incremental.
The larger opportunity now lies in extending similar performance into rural areas where fiber deployment costs and lower customer density have historically limited investment.
Starlink is addressing part of that performance gap from a different direction. Its nationwide 100/20 Mbps achievement rate has risen from 18.9 percent to 40 percent in one year, demonstrating significant network improvement.
However, the difference between Starlink’s 40 percent national performance and the widespread 60–70 percent performance achieved by fixed broadband networks shows that satellite connectivity is not yet matching fiber and cable performance consistently.
The next stage of U.S. broadband competition will therefore be defined less by basic connectivity and more by consistent high-speed performance, rural coverage, capacity, latency and network quality.
For broadband operators, the Ookla results also highlight where future network investment is likely to deliver the greatest impact: rural fiber expansion, capacity upgrades, fixed wireless access and technologies capable of narrowing the remaining urban-rural performance gap.
BABURAJAN KIZHAKEDATH